Safe Detours
Category: Self-guided Project
Skills: Data Mining, Machine Learning, Natural Language Processing
Tools: MIT ade20k dataset, Python, PyTorch, ArcGIS Pro, Google Maps API, Twitter API, Figma
Safe Detours
Category: Self-guided Project
Skills: Data Mining, Machine Learning, Natural Language Processing
Tools: MIT ade20k dataset, Python, PyTorch, ArcGIS Pro, Google Maps API, Twitter API, Figma
This project leverages machine learning techniques to predict perceived cycling safety in Austin, Texas with visual and ethnographical data. The data inform a mobile application that assists cyclists to identify potential accident risks on their routes and suggests safer detours.
Step 1: Area of Interest Selection & Dataset Creation
After confirming the topic, I selected the area bounded by coordinates (30.2711(S), 30.2956(N), -97.7437(W), -97.6870(E)) as the area for data mining.
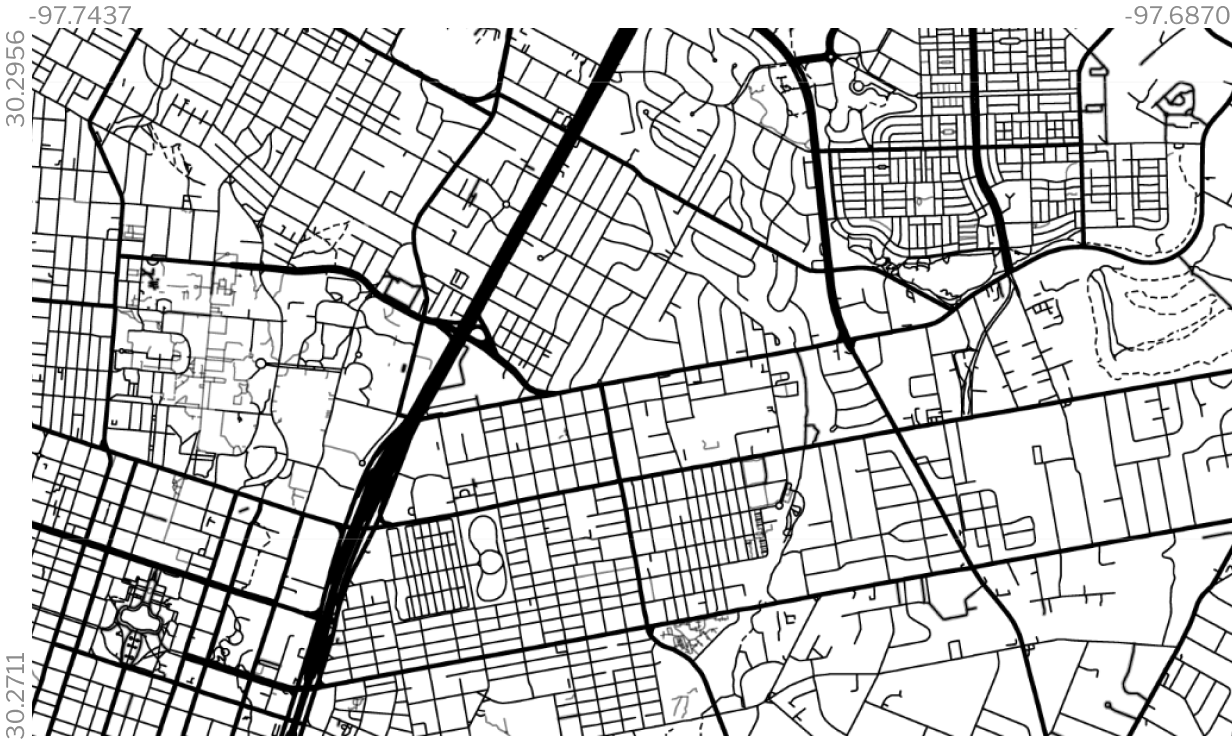
The Area of Interest
Part 1: Request Point Generation & Google Street View Images Acquisition
Then, the request points for google street view API Image Acquisition is generated at every point with a GSV photo within the research area - which is 5,502 points. Photos with a FOV of 120° for 0°, 90°, 180°, 270° in relation to the initial camera position is acquired, which makes the total amount of images 22,008. These photos, each has a resolution of 600*400 pixels, will be used as the initial data for image segmentation.
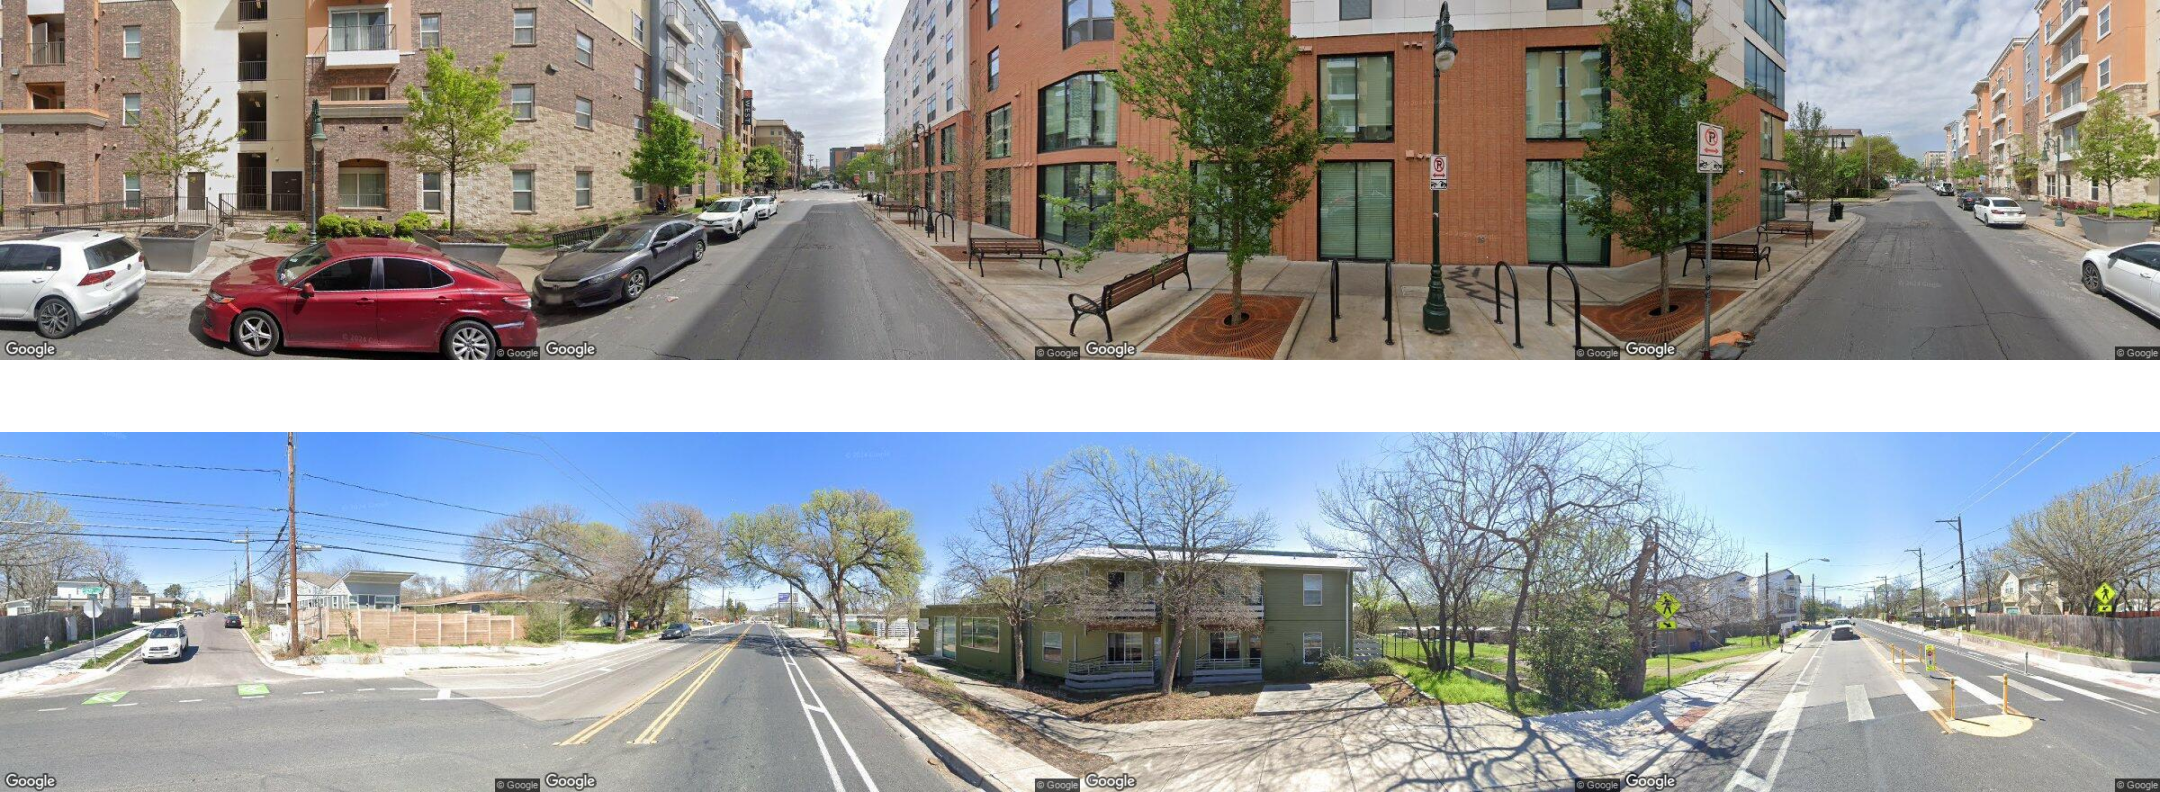
Two samples of the images acquired at each point
Part 2: DPT Image Segmentation Based on MIT ade20k Model
For a general adaptability of the segmentation scores, I selected MIT's ade20k model and applied image segmentation using DPT, generating segmented images and a csv table of the score of each object (scoring sheet) that is recognized and segmented from the image. The image below is the segmented images of the same images shown in part 1.
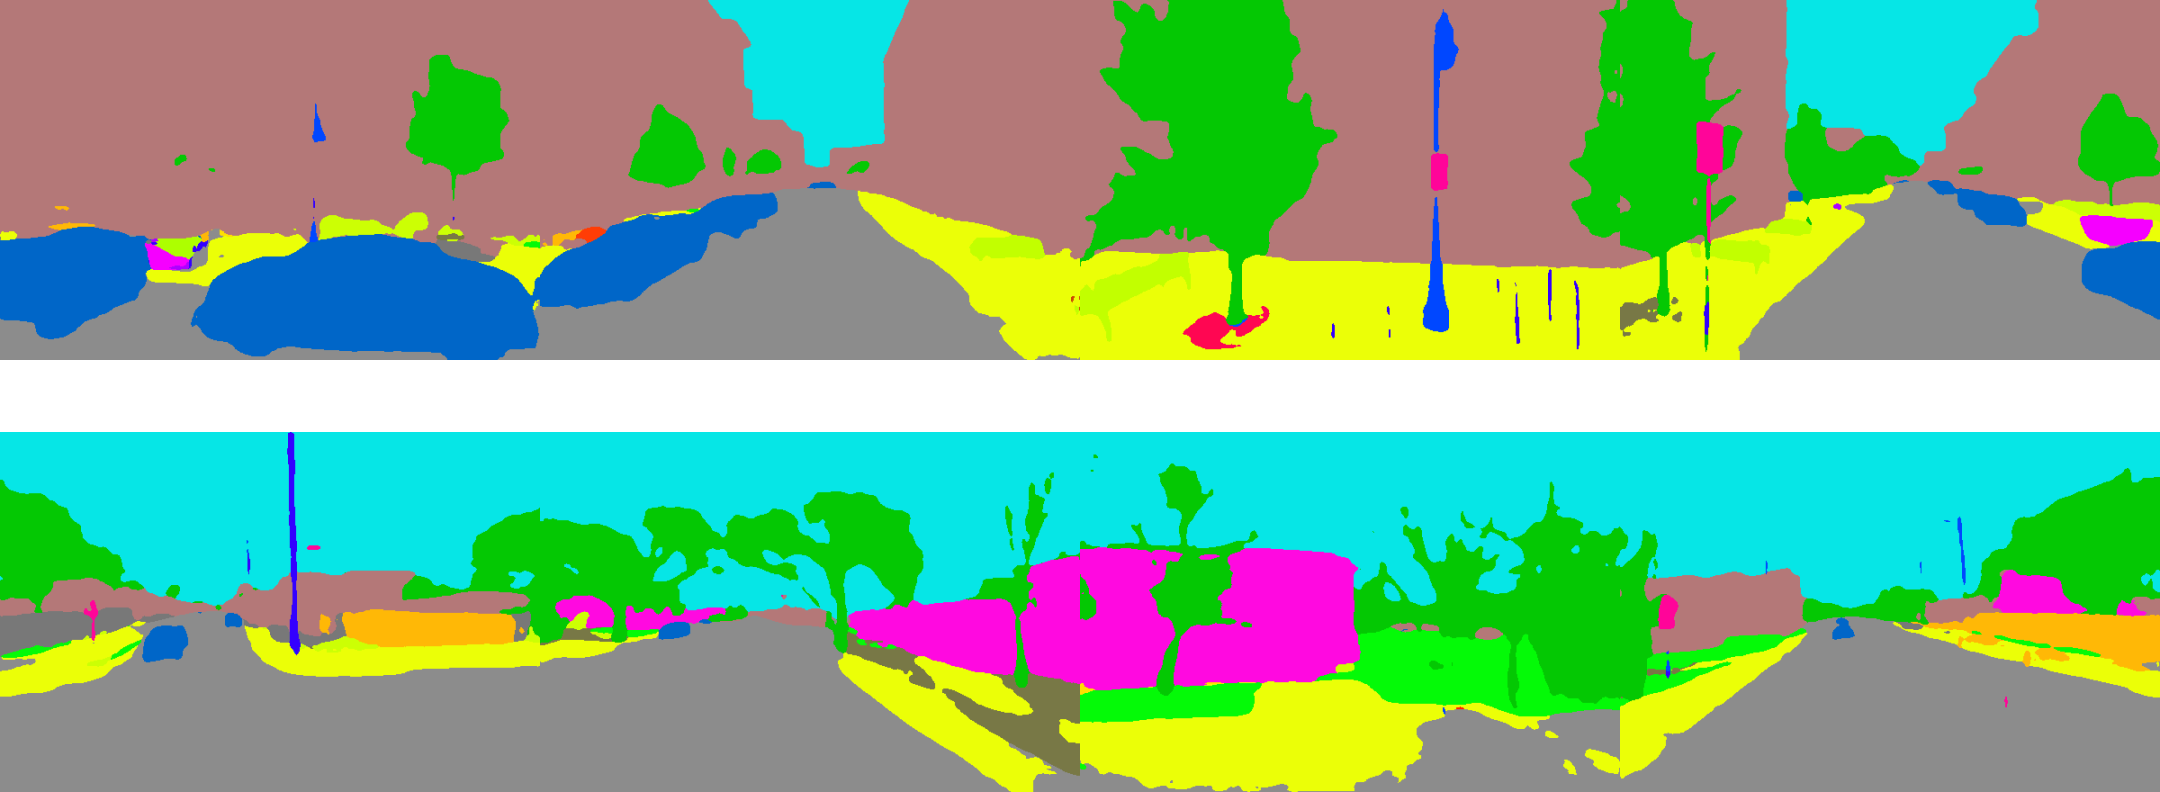
Segmentation results of images shown in part 1
Part 3: Establishment of Scoring Sheet
After segmenting the image, a script runs and generates a scoring sheet of segmentation for each image. This is a visual demo of its process.
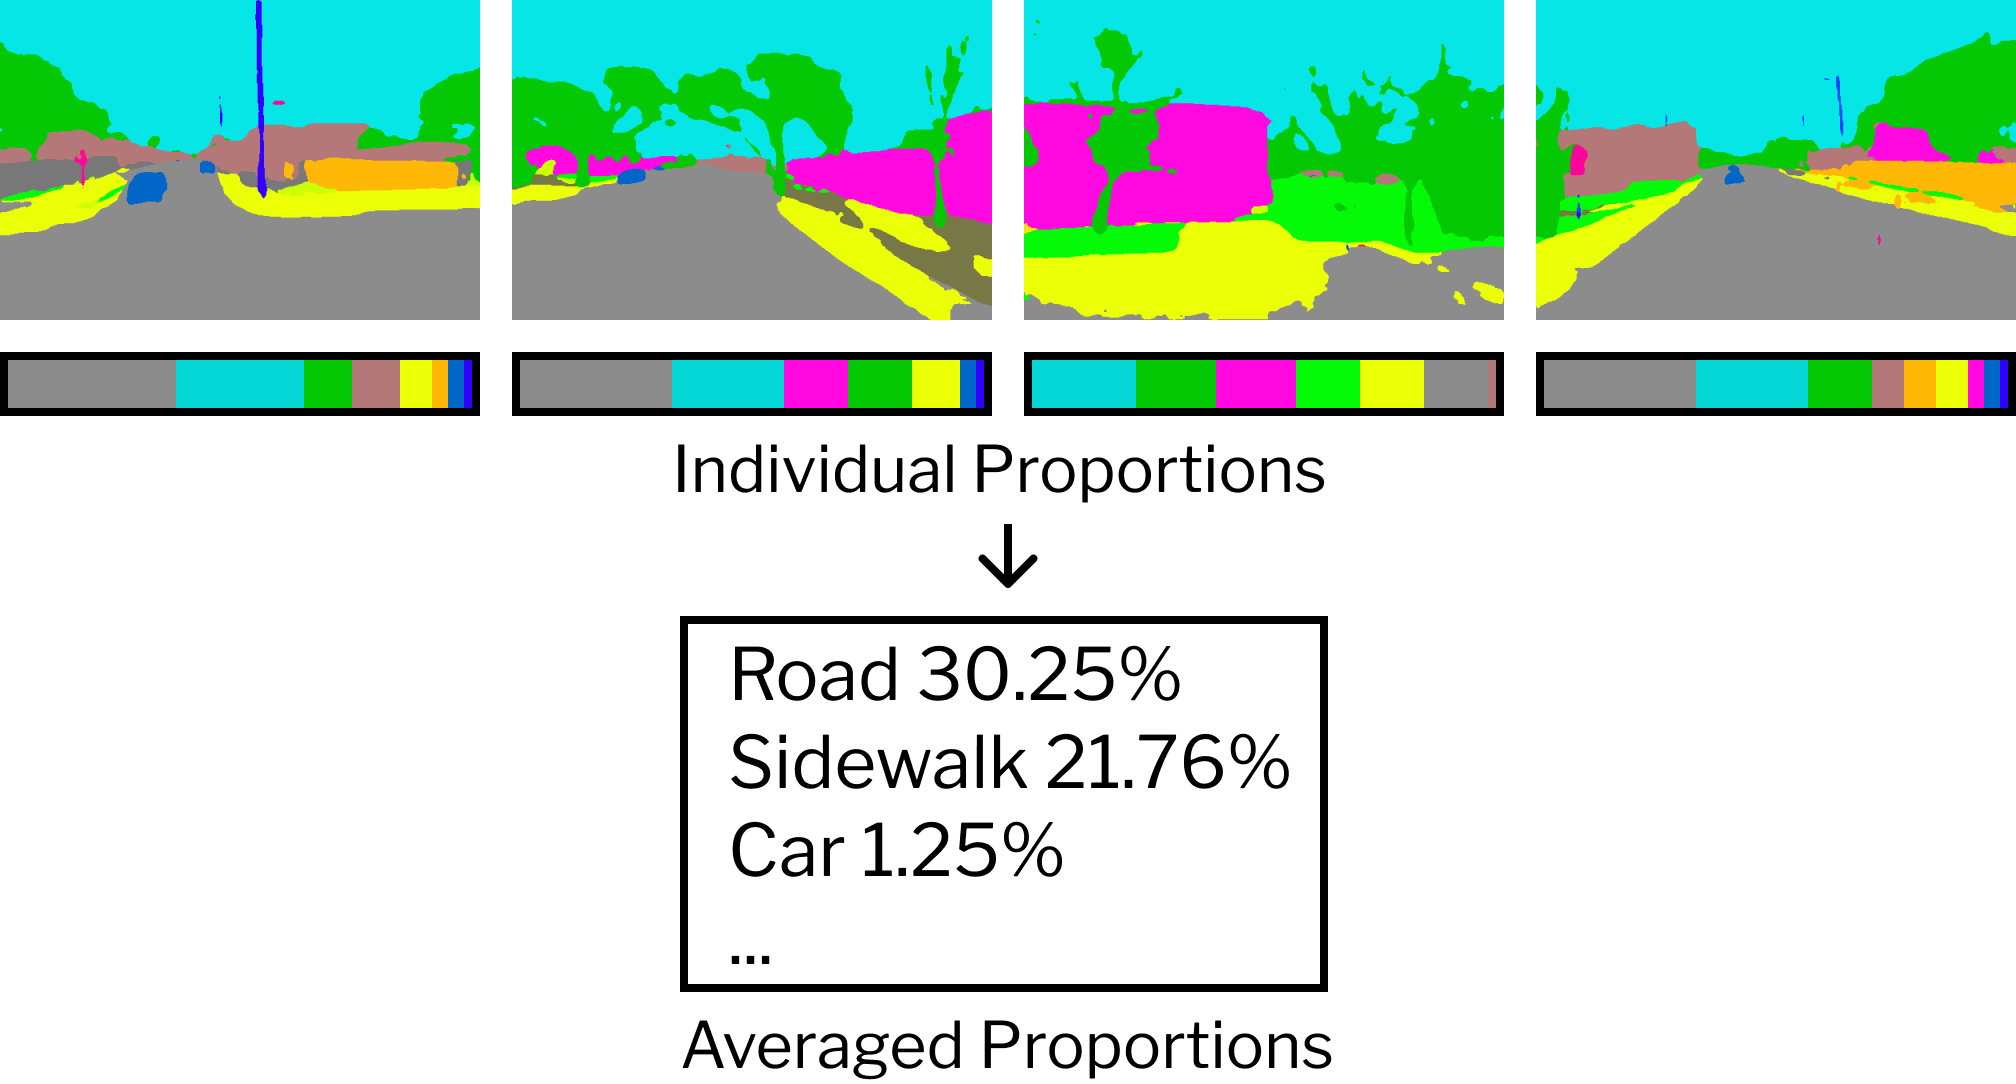
Scoring Sheet Creation Visualized Demo
Step 2: Random Forest Training and Prediction
Part 1: Perceived Cycling Safety Index Training
To supplement the training model with empirical data to make it more accurate, I designed a one-question surveys, disseminated them to different people, and collected 20 responses. Due to a lack of time, I used expert learning - using 20 images as an example and the rest 160 as an exam - to finish the 200 sets of survey data for initiating the random forest training model.
The question: How safe from accidents would you think you will be if you are cycling here?
The scale:

Part 2: Perceived Cycling Safety Index Prediction
Then, after running the model and generating a csv of perceived cycling safety index, I appended this csv to correspond to the coordinates of their corresponding GSV photos in ArcGIS Pro, and visualized the scores only at road intersections.
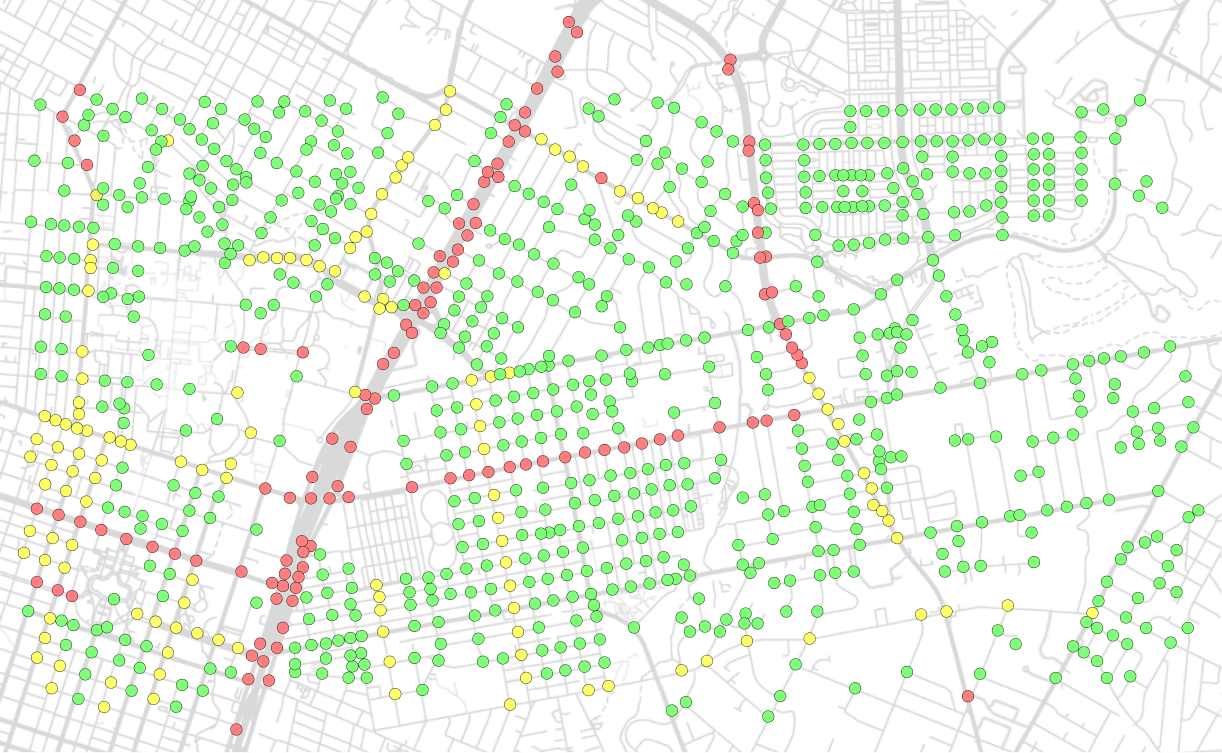

Final Visualization
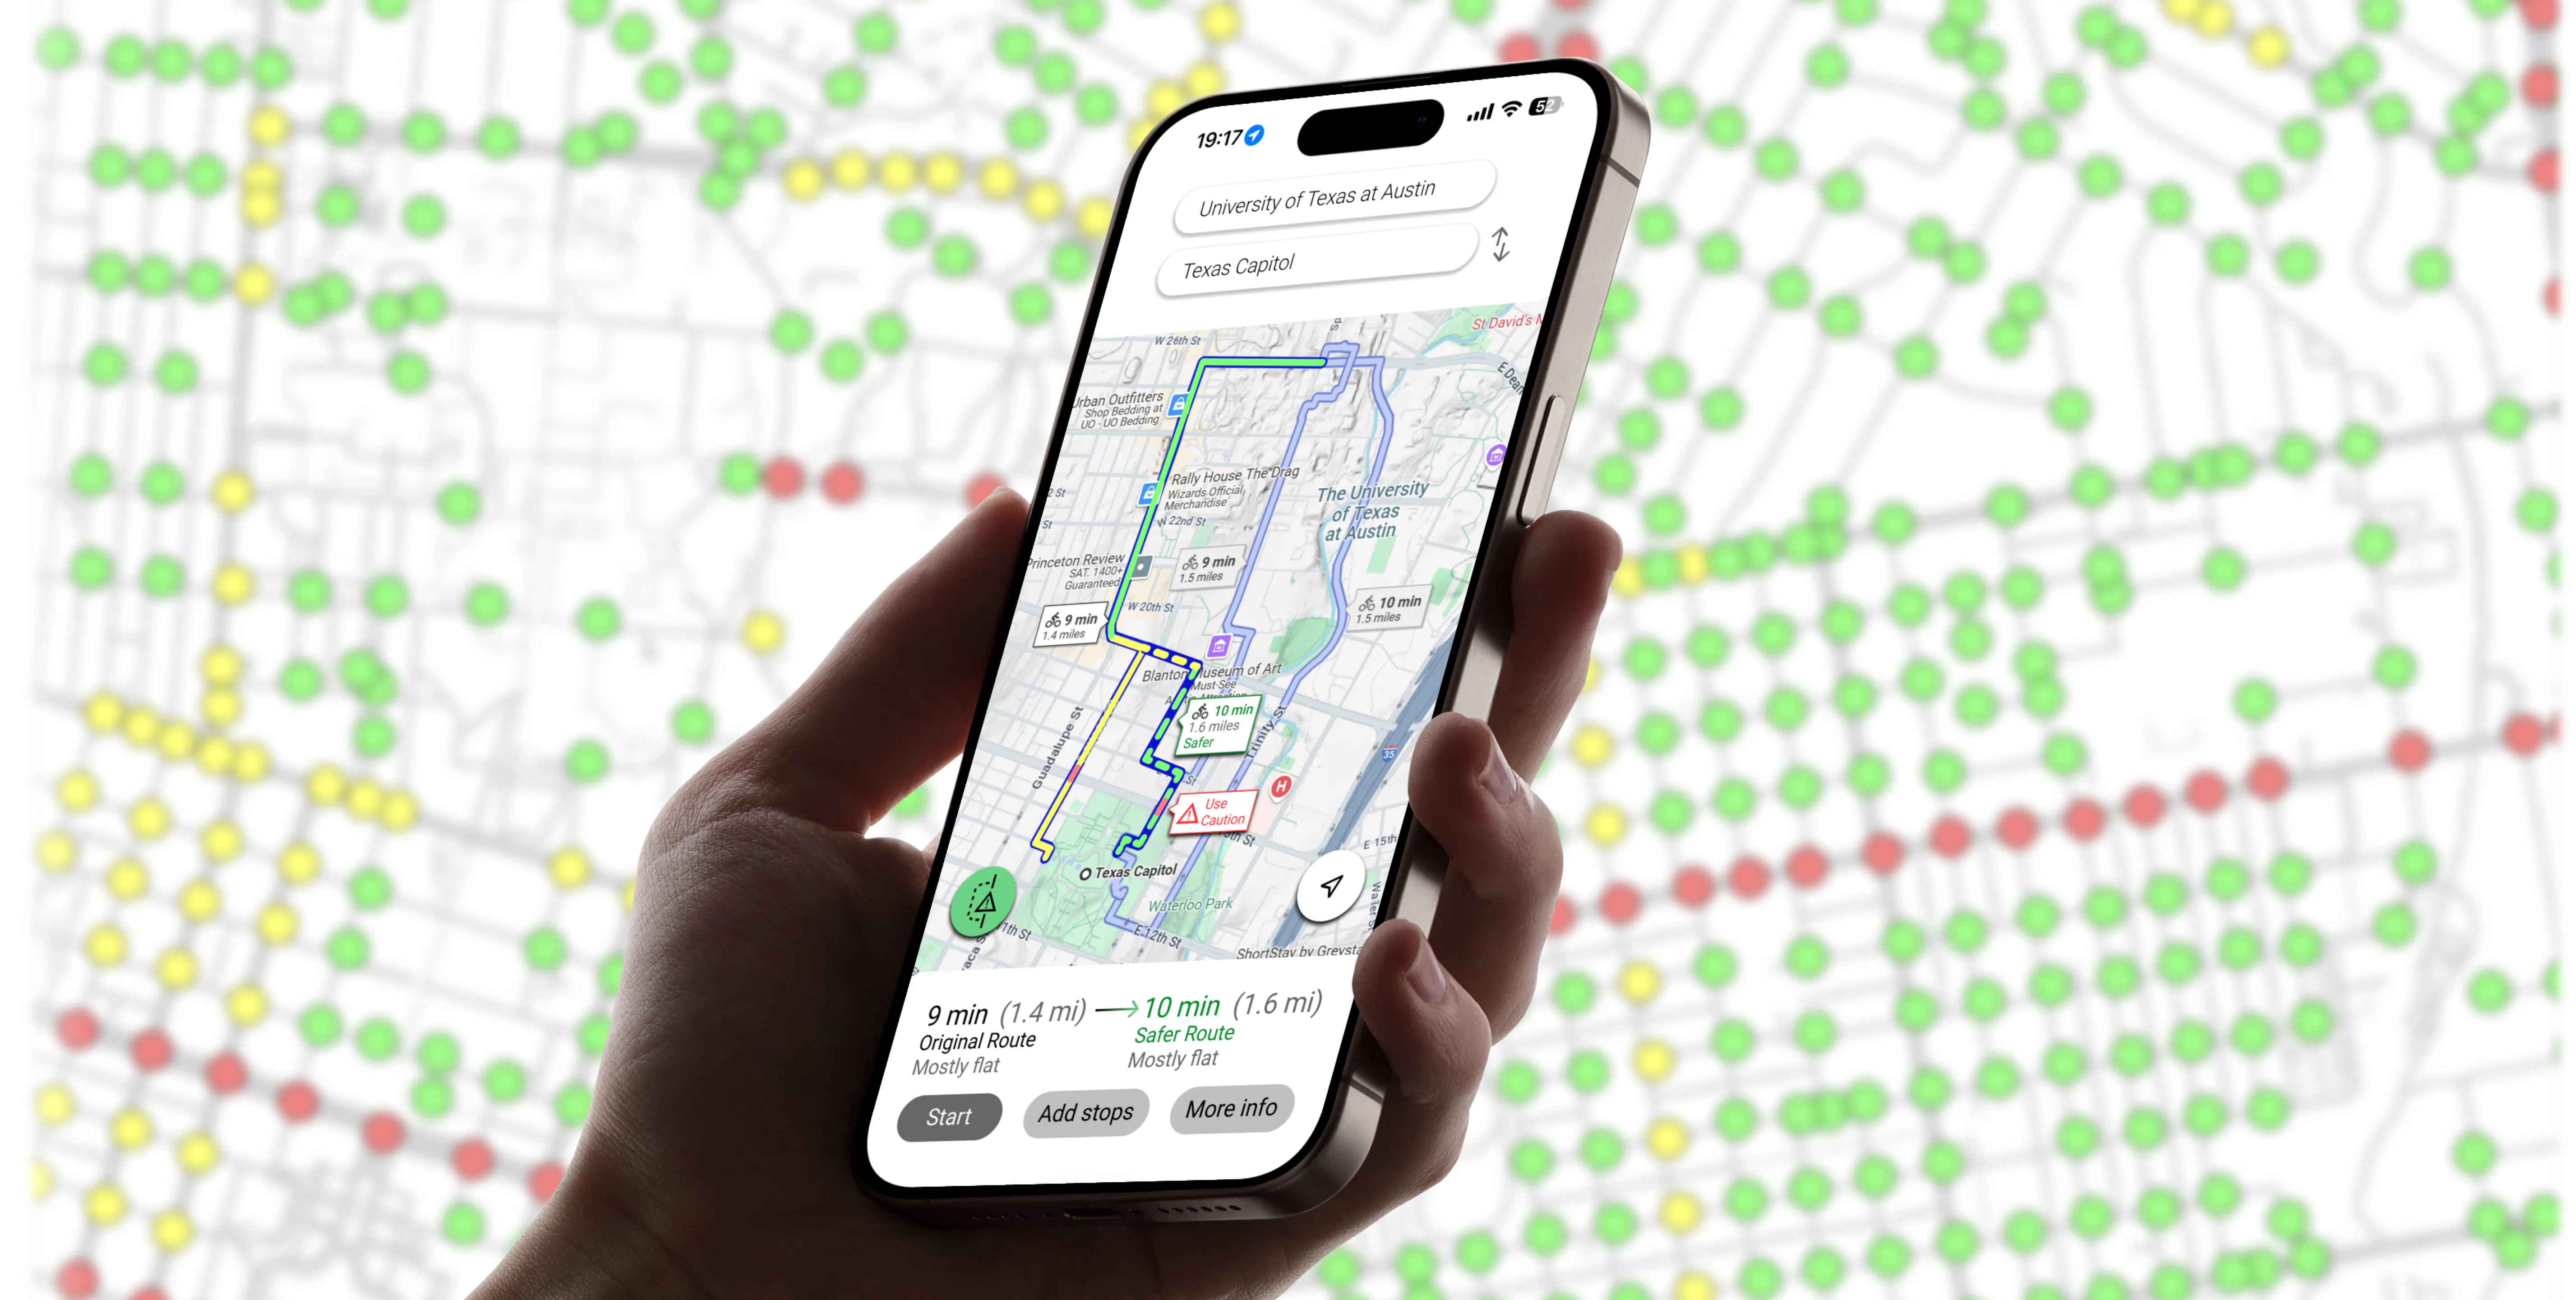
Step 3: Product Design (The "Safe Detours" App)
Due to time constraints, I only finished part of the development of the prototype. Here is the design toolkit of the system and the 4 core-functionality screens:

Design kit
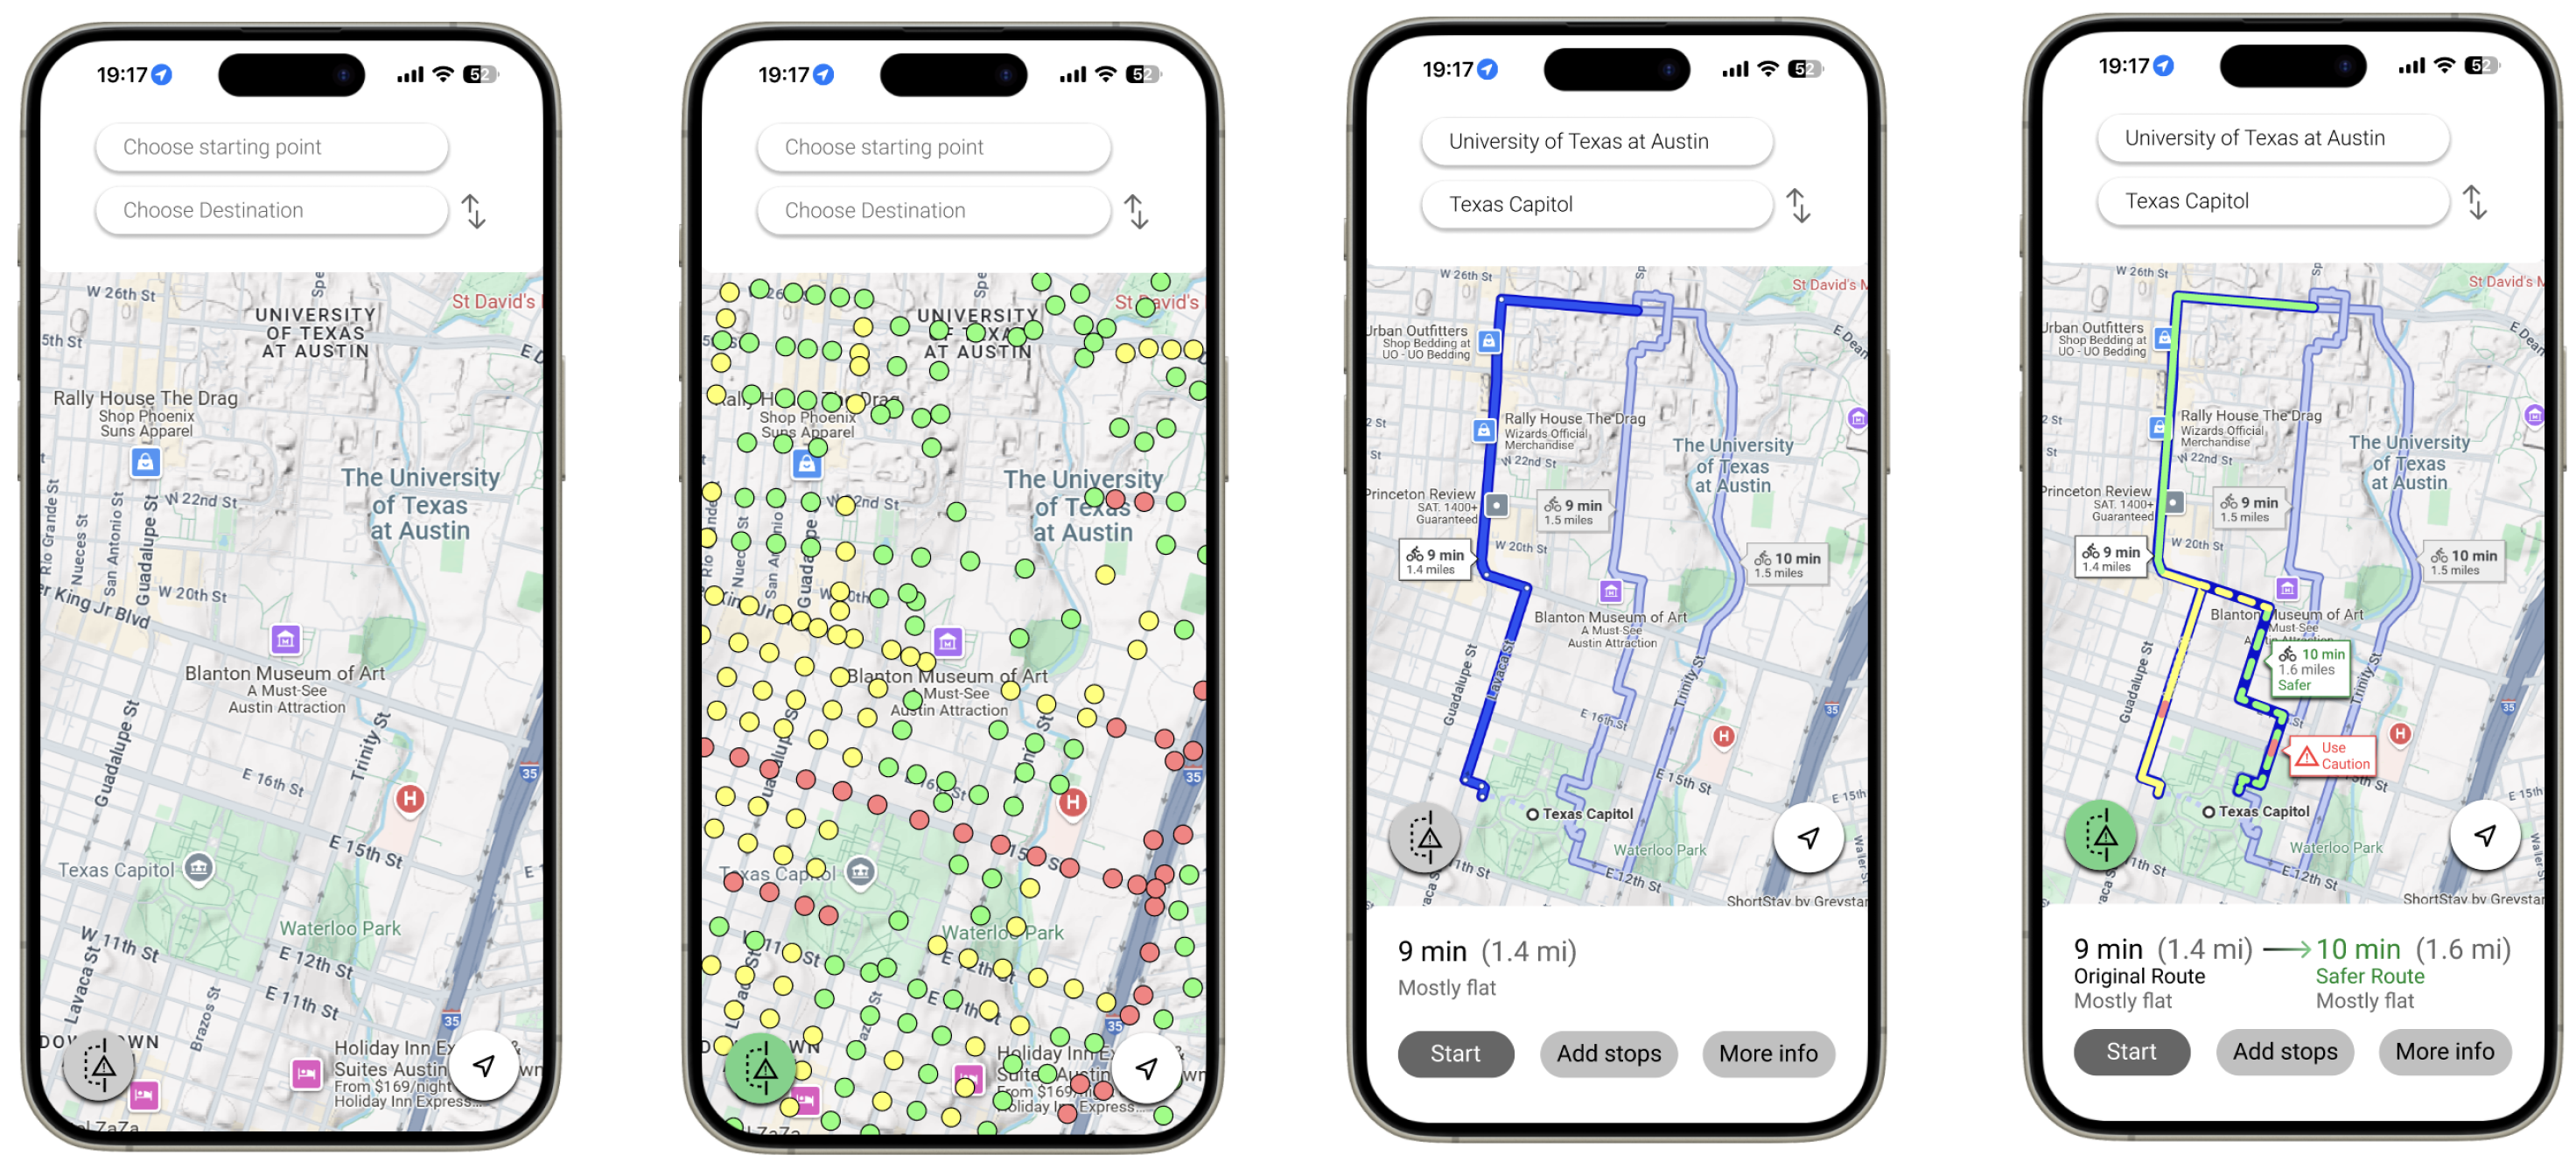
From left to right:
Information view - "Safe Detours" disabled
Information view - "Safe Detours" enabled
Navigation view - "Safe Detours" disabled
Navigation view - "Safe Detours" enabled