Project Image

Unmaking "Friction"

Friction, a terminology that is commonly used in physics, is often used to describe the hardship of accomplishing a task in a sequence of actions.


Course: UT Design Inquiry Studio

Professor: Elisa Ngan

Skills: Design Inquiry, User Experience Research, Research-driven Design, Data Gathering, Data Analysis

Tools: Figma, Adobe Illustrator

The project finds and inquires an urban object that users may come across every day. Use the design inquiry to analyze its user task flow and identify one subject of study. Use collected data to quantize the subject into data streams and visualize it with a unified language.

Context

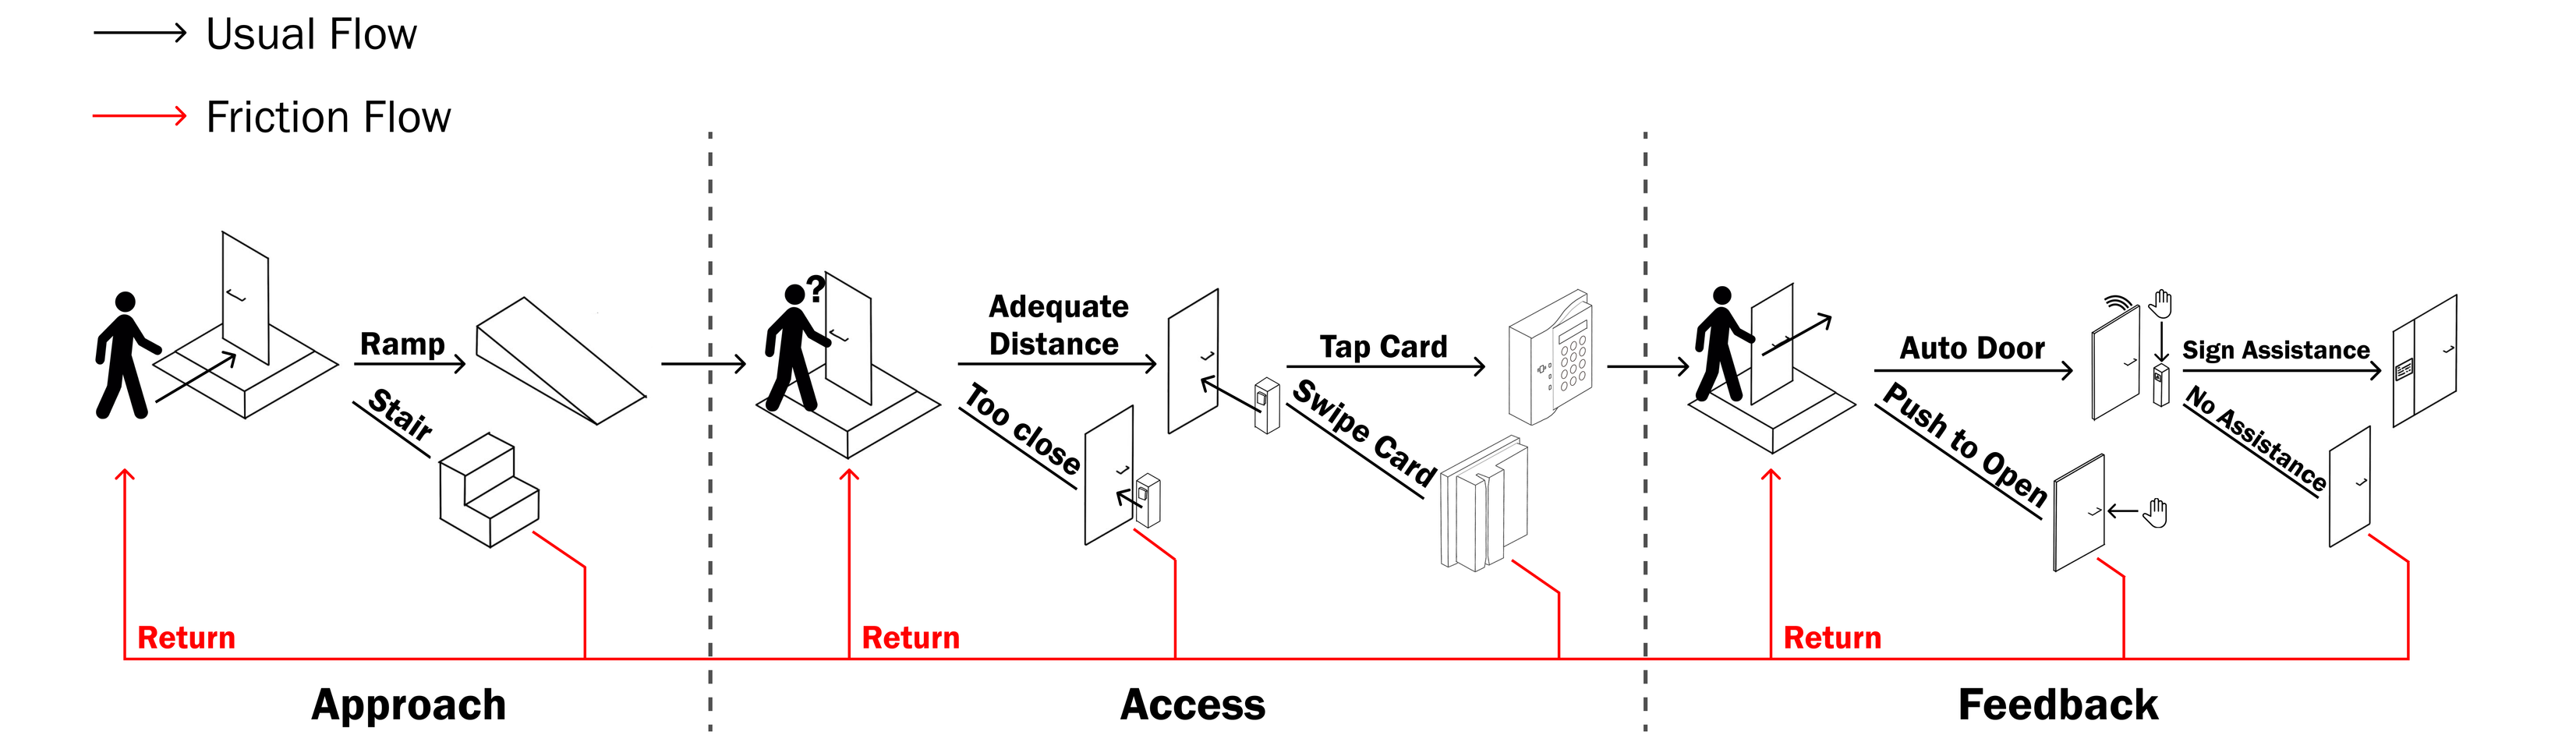
MCard Reader System, an identification system deployed within the bounds of University of Michigan, limits building access at specific timeframes to only students and the faculty.

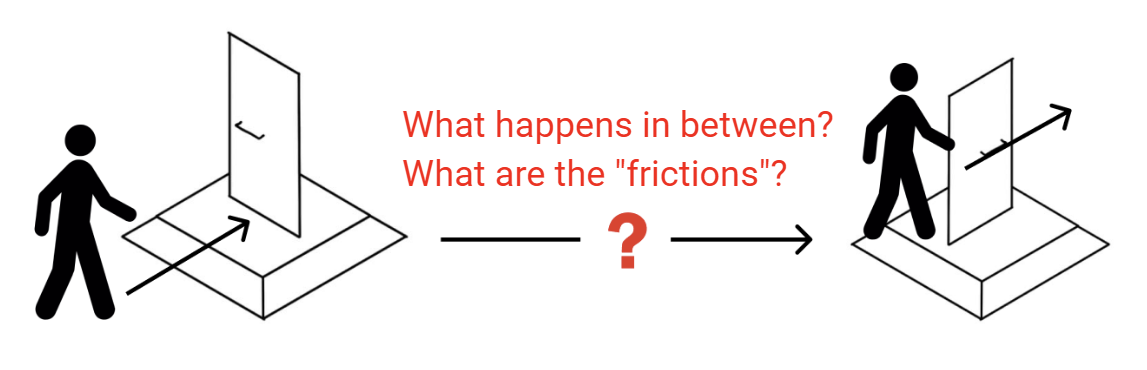
The motivation for choosing this urban object is because of an ACL torn relapse happened to me in 2023. The inevitability of using an accessible built environment informs me of the “friction” that people with mobility issues face at getting access to university facilities.

Although the 1991 Americans with Disabilities Act regulates that each building must have at least one accessible entrance, some of them are either too hard to find or need a long detour comparing to other entrances, etcetera.

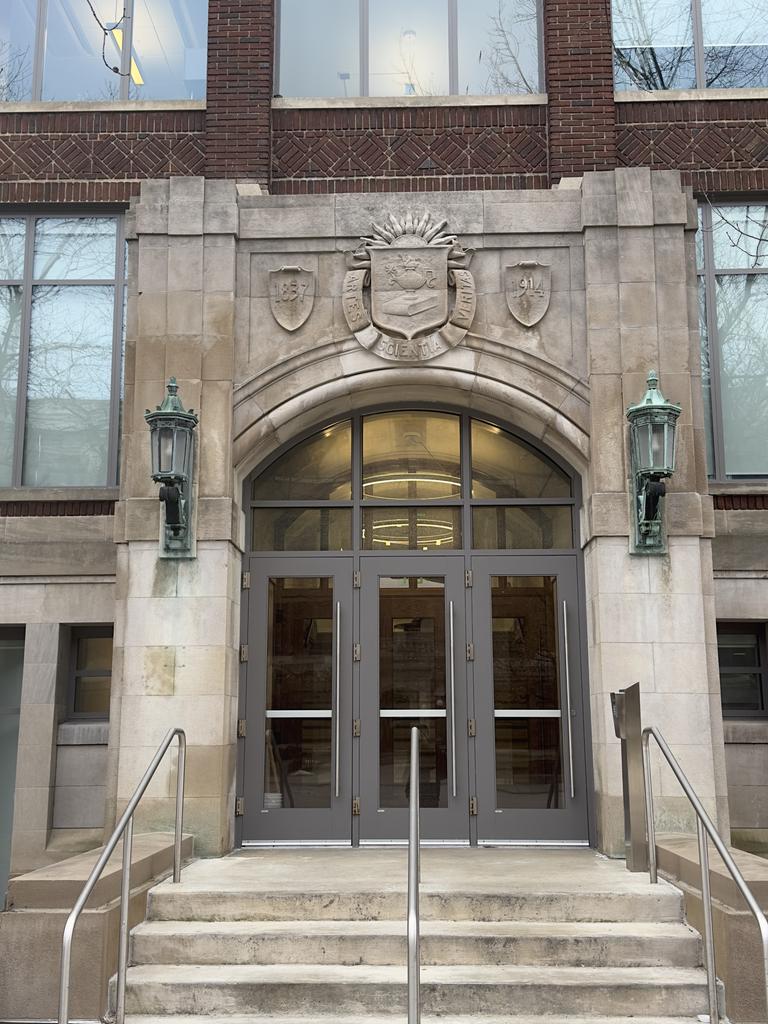
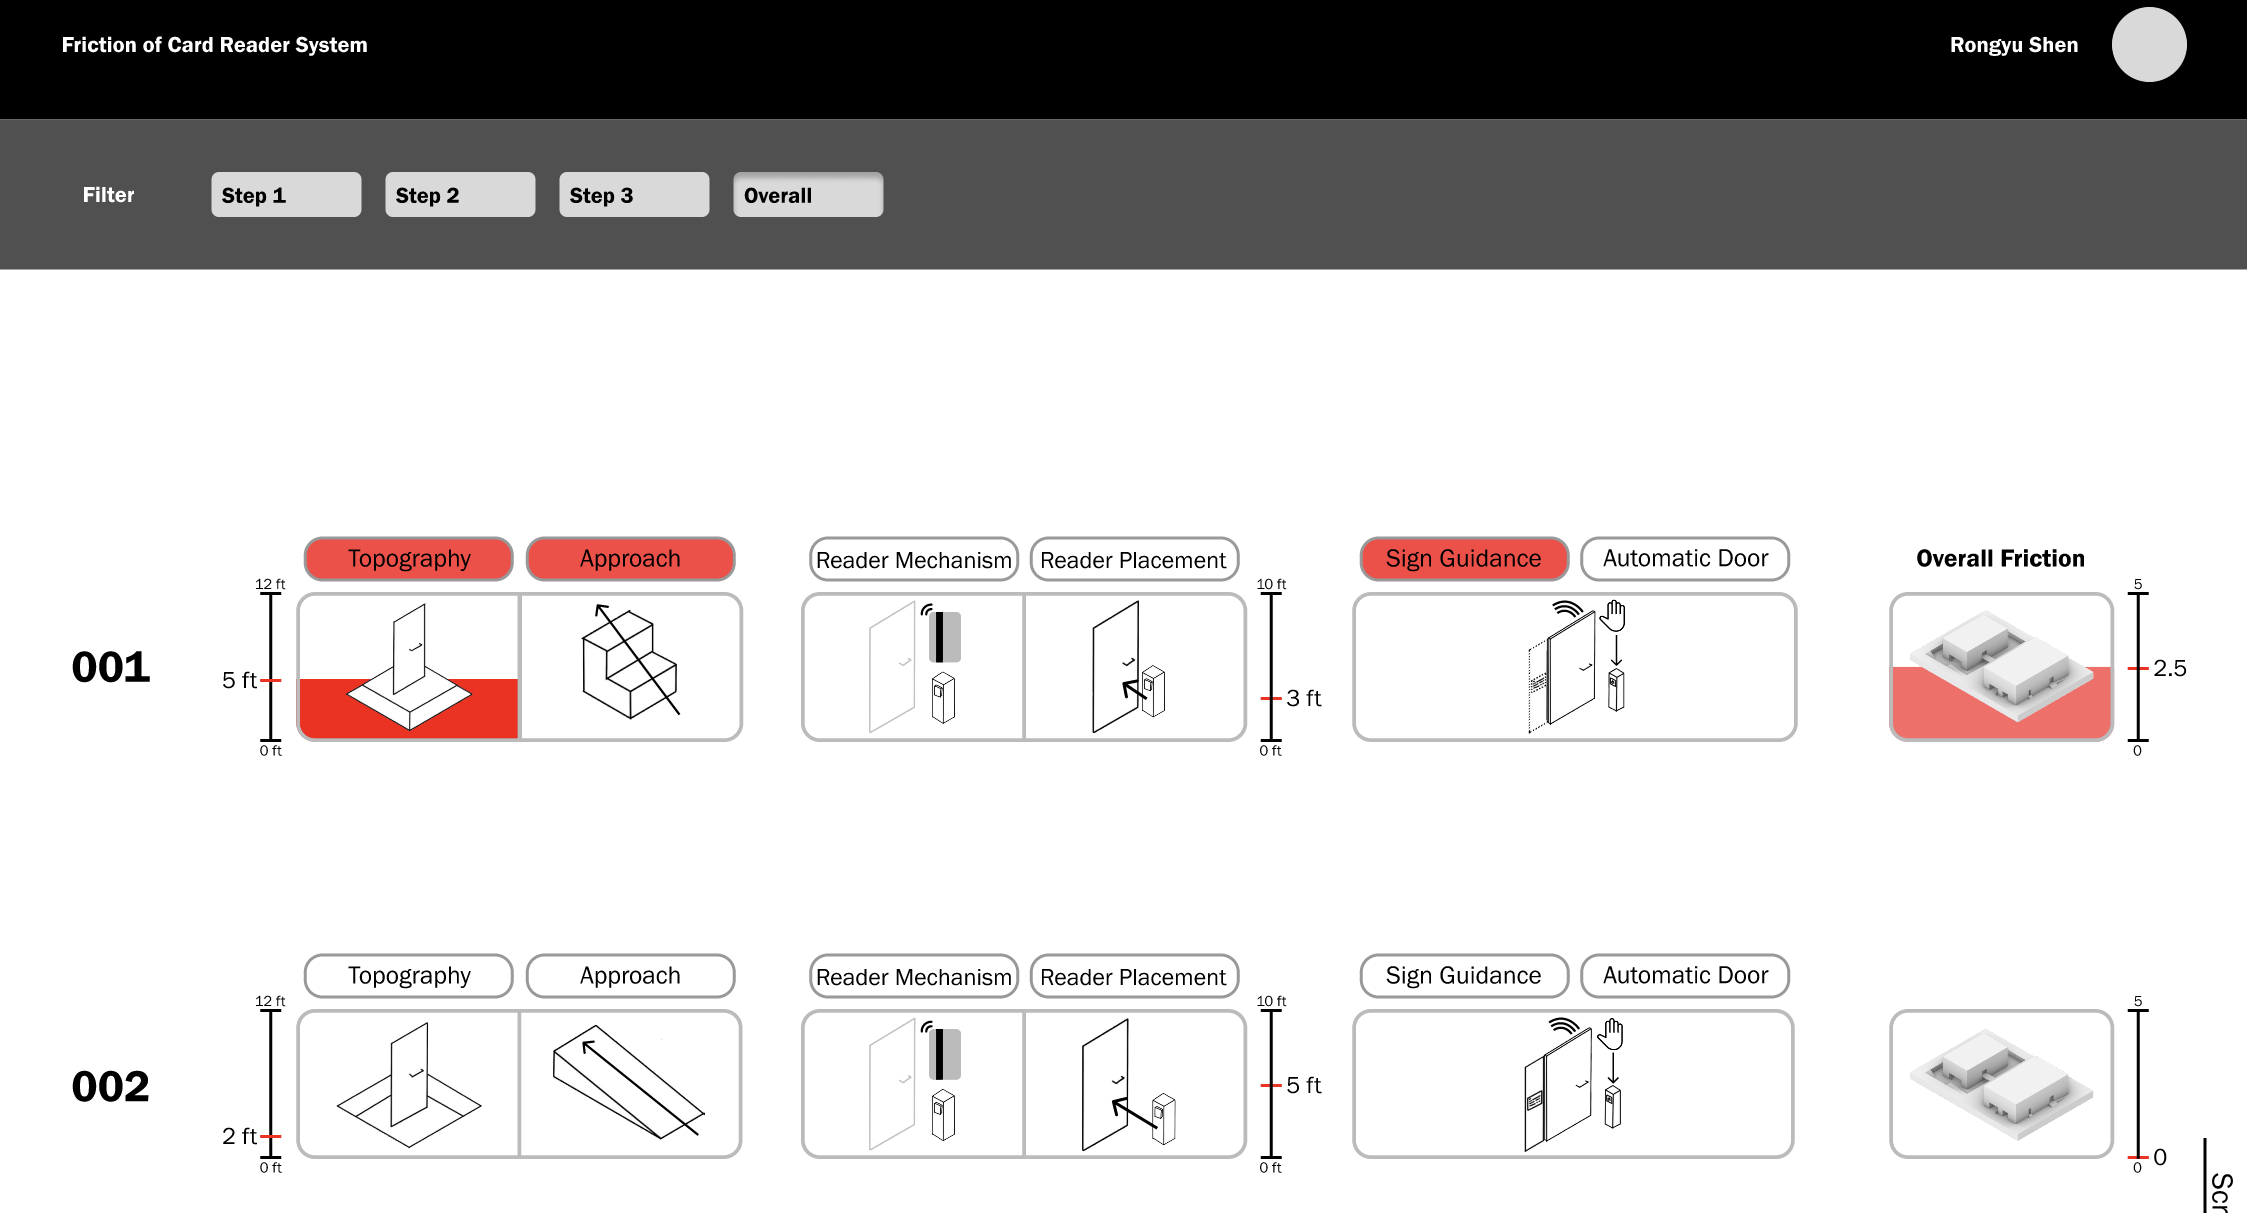
The image in this section shows an example of the system.

UUID: 001; Location: School of Kinesiology; Friction Index: 2.5

Design Inquiry


How the Friction within the Experience of MCard Reader Systems is Influenced by themselves and their Surrounding Environment?


Research - Process of "Unmaking"

Step 1: Inventory Audit


Walking around the research area to document every MCard Reader in the area, and catagorize them in multiple quadrants of customized catagories. The research area is partitioned into 6 geographical areas shown by different image background colors, and 30 samples of the MCard Reader System is collected for later analysis.


Step 2: Friction Visualization - What factors produce friction?


Upon the observation and experience of these samples, the system is deconstructed to individual parts for an analysis of factors causing the friction within the process. The 3 levels of identified possibilities where friction can occur are further segmented to physical factors that potentially cause and accumulate friction to the entire system.


Step 3: Friction Abstraction - User Experience Linearization


"Friction" builds up by accumulation, so linearizing the three levels of friction identified in the previous step into a user task flow is a crucial next step in the research process towards quantizing the accumulation of friction at different stages of the task flow.


Step I: Purpose the design inquiry, and visualize friction accordingly.


Step II: Associate key parts causing friction in the user experience with the task flow for a systemized unmake of the experience, which is a quantification in this case.

Step 4: Friction Unmade - Quantification Exhibition Interface


After unmaking the experience in to a linearized system, quantify the 30 instances collected and mapped in "Inventory Audit" and fit them into the quantified system derived from "Friction Abstraction" to visualize the amount of friction accumulated at each step.


Above is a guide to the quantification system and how to read and use the interface. to visit the scrollable interactive interface, please click on the image below and scroll down:


data visualization

Step 5: Remaking Friction - Where is it, and what should we do?


Calling back to the spatial categorization in step 1, in order to generate more analytics on the data, a geospatial analysis of the research area divided into various interest areas corresponding to the inventory audit is produced. This map leads to some educated speculations on the reasons for different extents of friction produced for different instances.


The generation of the geospatial analysis of the reseach area can hopefully inspire some thoughts on future campus infrastructure investment strategies to make more of these systems comply to ADA standards.


Looking Back - What is there, and what are the next steps?


Semantically, the index system might not always reflect the actual experience. Take instance 026 as an example. This is what it looks like on the interactive interface:

Instance 026 - Friction index 2.5

And on the left, this is what it looks like in reality. Although stairs present at this entrance, it features a lengthy ramp for wheelchairs. Also, for most of the time in a day (8 am to 9 pm), this entrance has high foot traffic so for people having trouble reaching the card reader, it is usually not a long wait until a nice person holds the door for them.

The lesson is, a quantified system cannot reflect all the truth, as human factors add a significant variable to it. For the next steps, I gathered some academic evidence for a quantified system describing accesibility. Using that as a capstone, I filed a document to the university about the extant issue on inconvenience that people with disabilities might still face when trying to access university properties.