Māori Urbanism - A GIS Analysis
Course: Intro to GIS
Professor: Anthony Bedogne
Group Member: Huy Dung Lou, Ruide Li
Responsibilities: Data Cleansing, Mapping
Tools: ArcGIS Pro Desktop, ArcGIS Storymaps, Adobe Premiere
Māori Urbanism - A GIS Analysis
Course: Intro to GIS
Professor: Anthony Bedogne
Group Member: Huy Dung Lou, Ruide Li
Responsibilities: Data Cleansing, Mapping
Tools: ArcGIS Pro Desktop, ArcGIS Storymaps, Adobe Premiere
This project is a GIS project that analyzes and illuminates the Māori population's evolving relationship with urban spaces in terms of spatial distribution and social interaction.
Step 0: Defining the Problem Statement
At first, we decided to look at a body of indigenous population - and we focused on the Māori population of Aoteaora (New Zealand). Urbanization has been a key factor contributing to their population increase, significantly influencing Māori lifestyles and spatial dynamics.
To explore these effects, we focused on Functional Urban Areas (FUA) classification, which defines geospatial boundaries encompassing urban cores and their economically connected commuting zones.
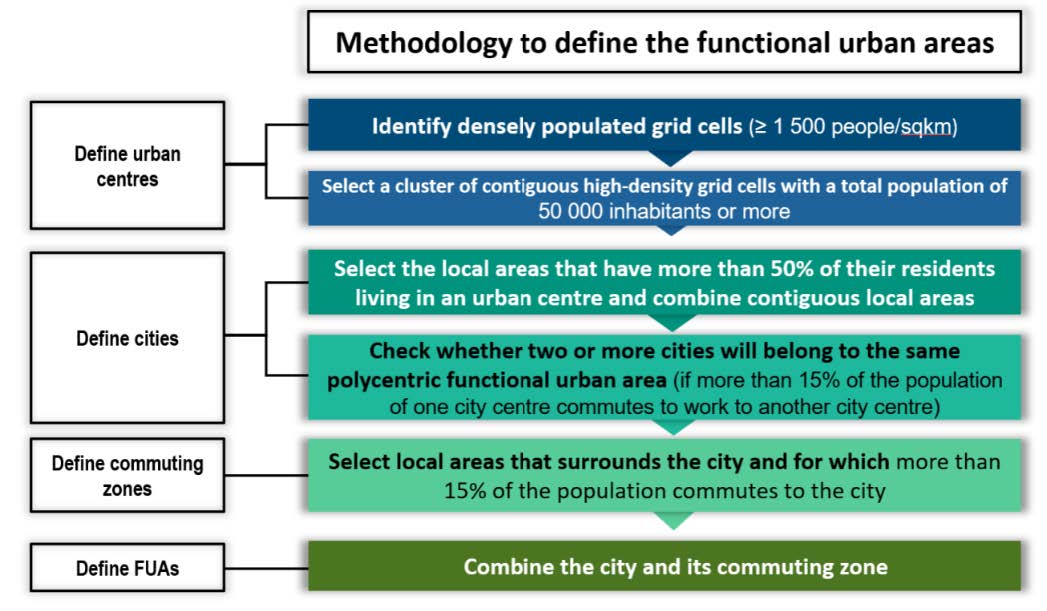
OECD's definition of FUA
Step 1: Dataset Identification and Integration
If you are more of a visual reader, please click here to access our video vignette of the project.
This research utilizes Functional Urban Area (FUA) classifications derived from Statistical Areas Level 1 (SA1), the smallest statistical units constructed from complete meshblocks. These SA1 units are aggregated into Statistical Areas Level 2 (SA2), which represent interlinked communities through socio-economic relationships and serve as the primary units for census data aggregation.
Key datasets for this study, sourced from Statistics New Zealand, include:
The hierarchical relationship between SA1, SA2, and FUA geospatial boundaries is critical for integrating the 2023 census data into the FUA framework. To achieve this, we implemented the following workflow:
By combining geospatial and statistical methods, this approach allows for a comprehensive analysis of Māori population trends across urban cores and metropolitan areas, enabling nuanced insights into the impacts of urbanization for further analysis.
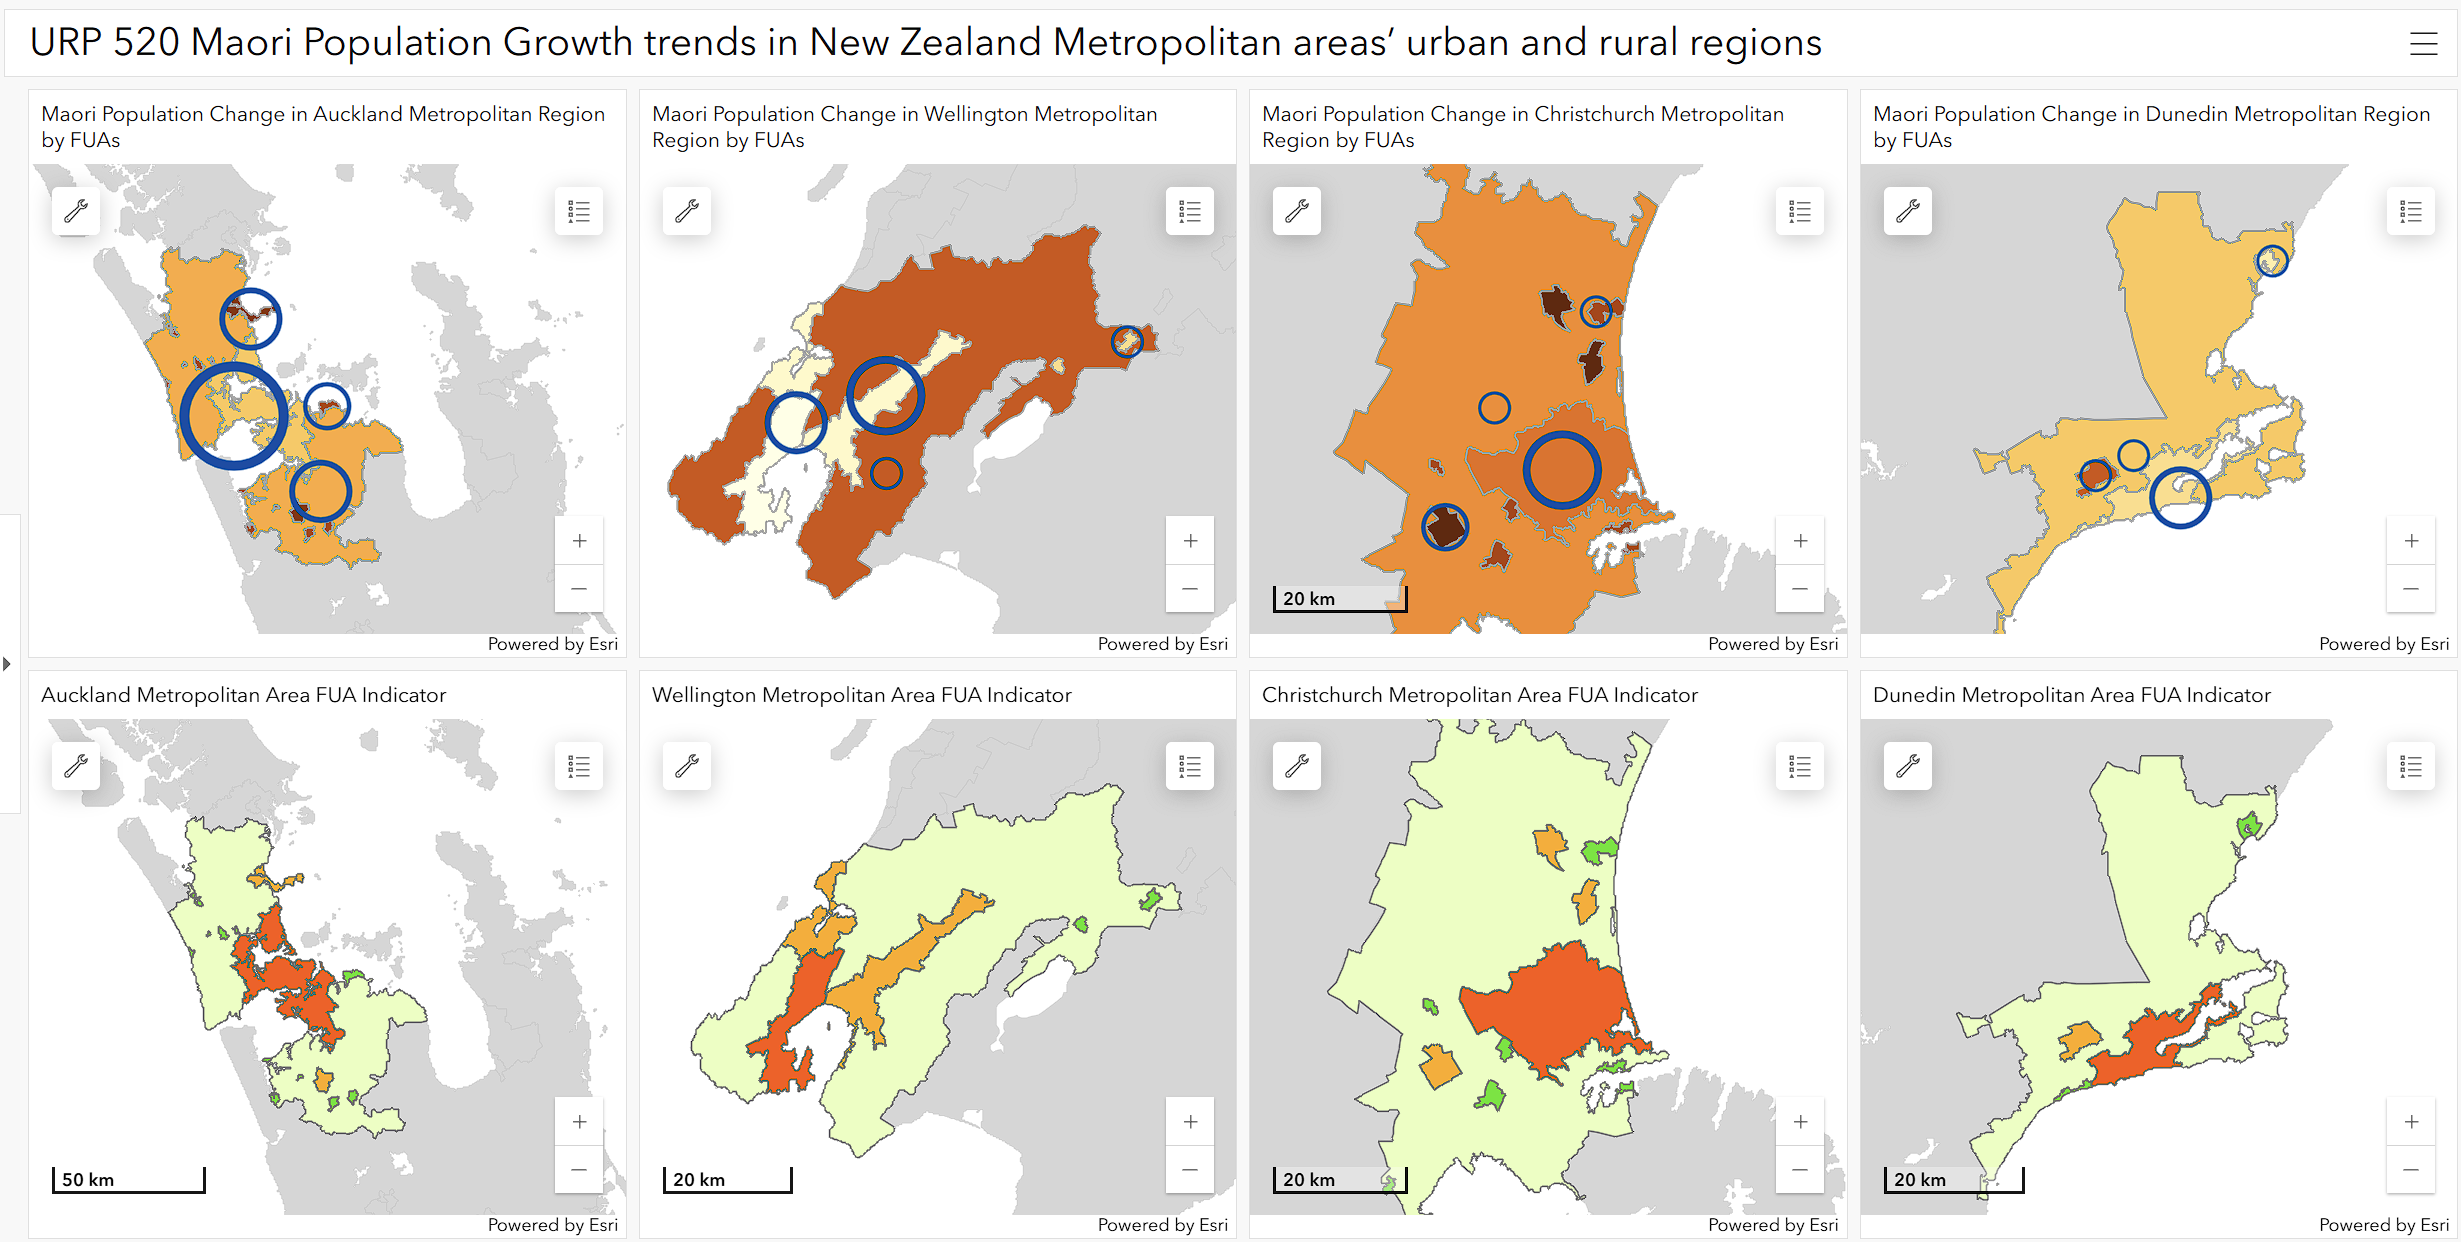
Step 2: Data Visualization
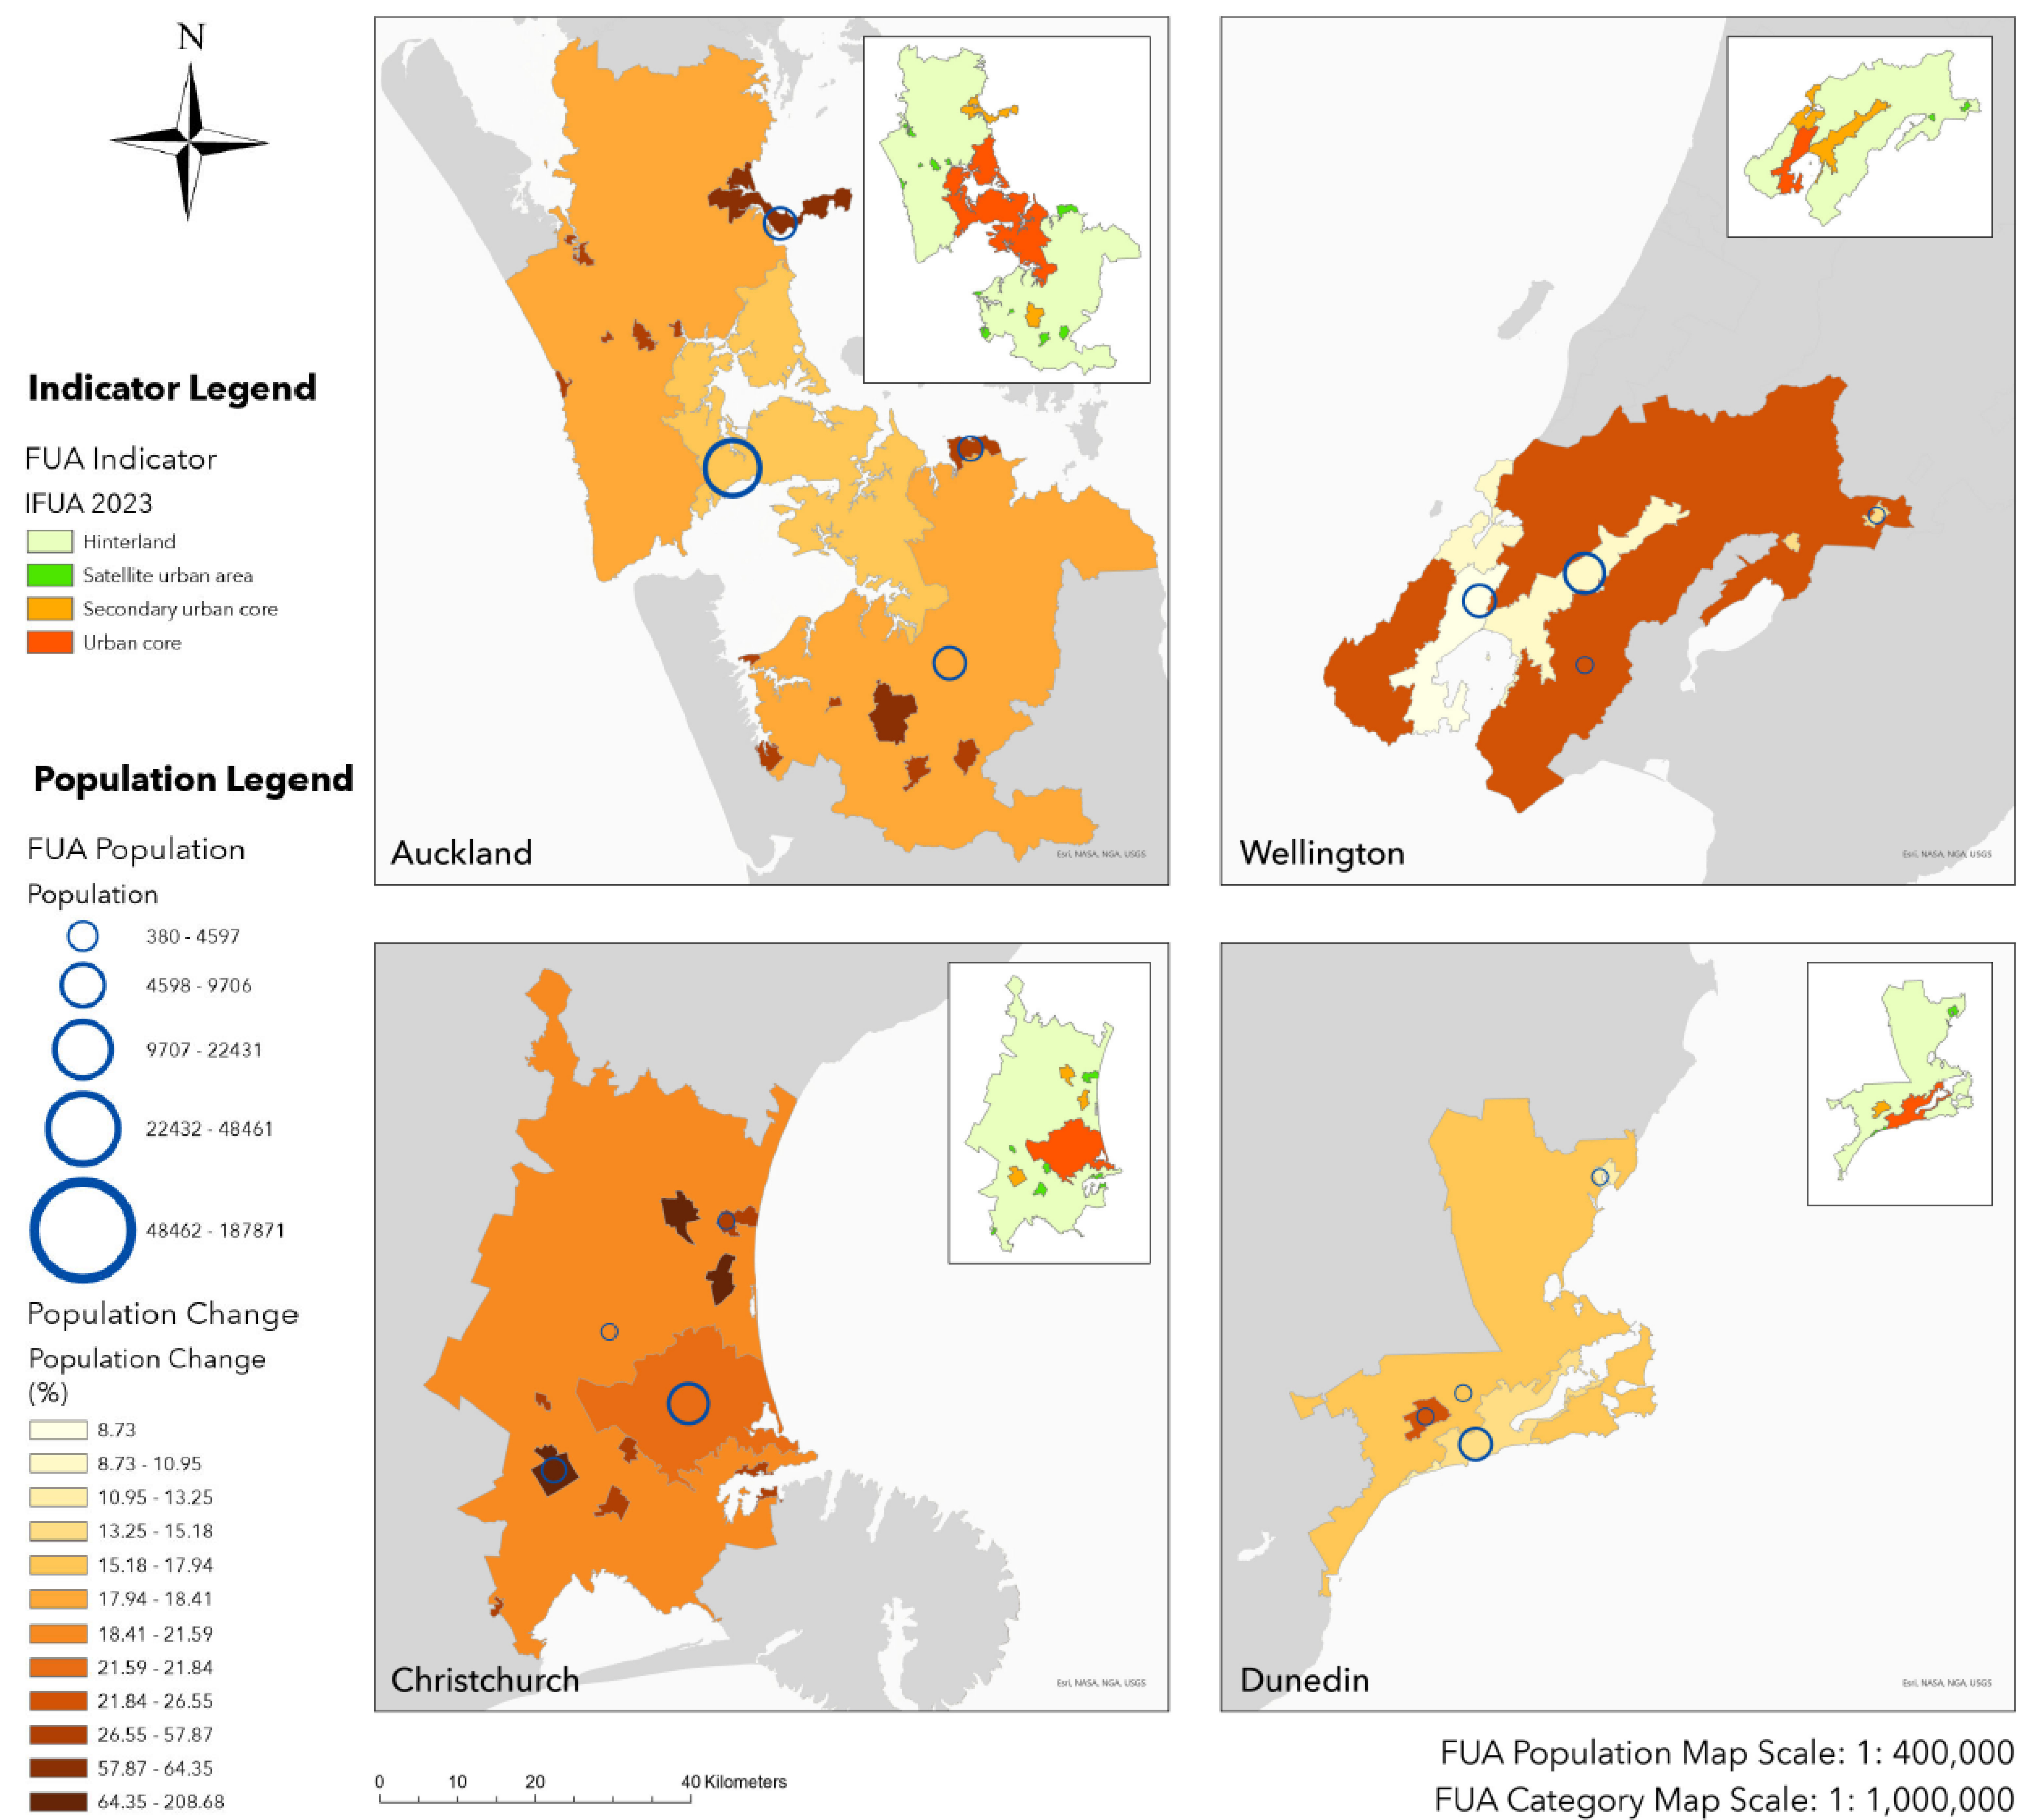
Final Visualization
After the data integration and visualization process, we observed variations in Maori population change rates across different FUA indicators. While the total Maori population remains highest in urban cores, a notable trend is that the population growth rates are higher in peripheral areas, such as secondary urban cores, satellite urban areas, and hinterlands. While there is an increase in Maori population in hinterland areas, the population count is relatively lower than urban cores, secondary urban cores, and satellite urban areas. We could draw the conclusions that urbanization and sprawl in New Zealand metropolitan areas have influenced the lifestyles of Maori residents, with many of the population choosing to commute to urban cores while living in secondary and satellite urban areas.
Click the image above to access the web map