Project Image

Newtrality

Course: Strategic Design and Urban Systems

Professors: Wonyoung So, Bryan Boyer

Teammates: Sean Kim, Richard Li, Norris Hsu

Responsibilities:

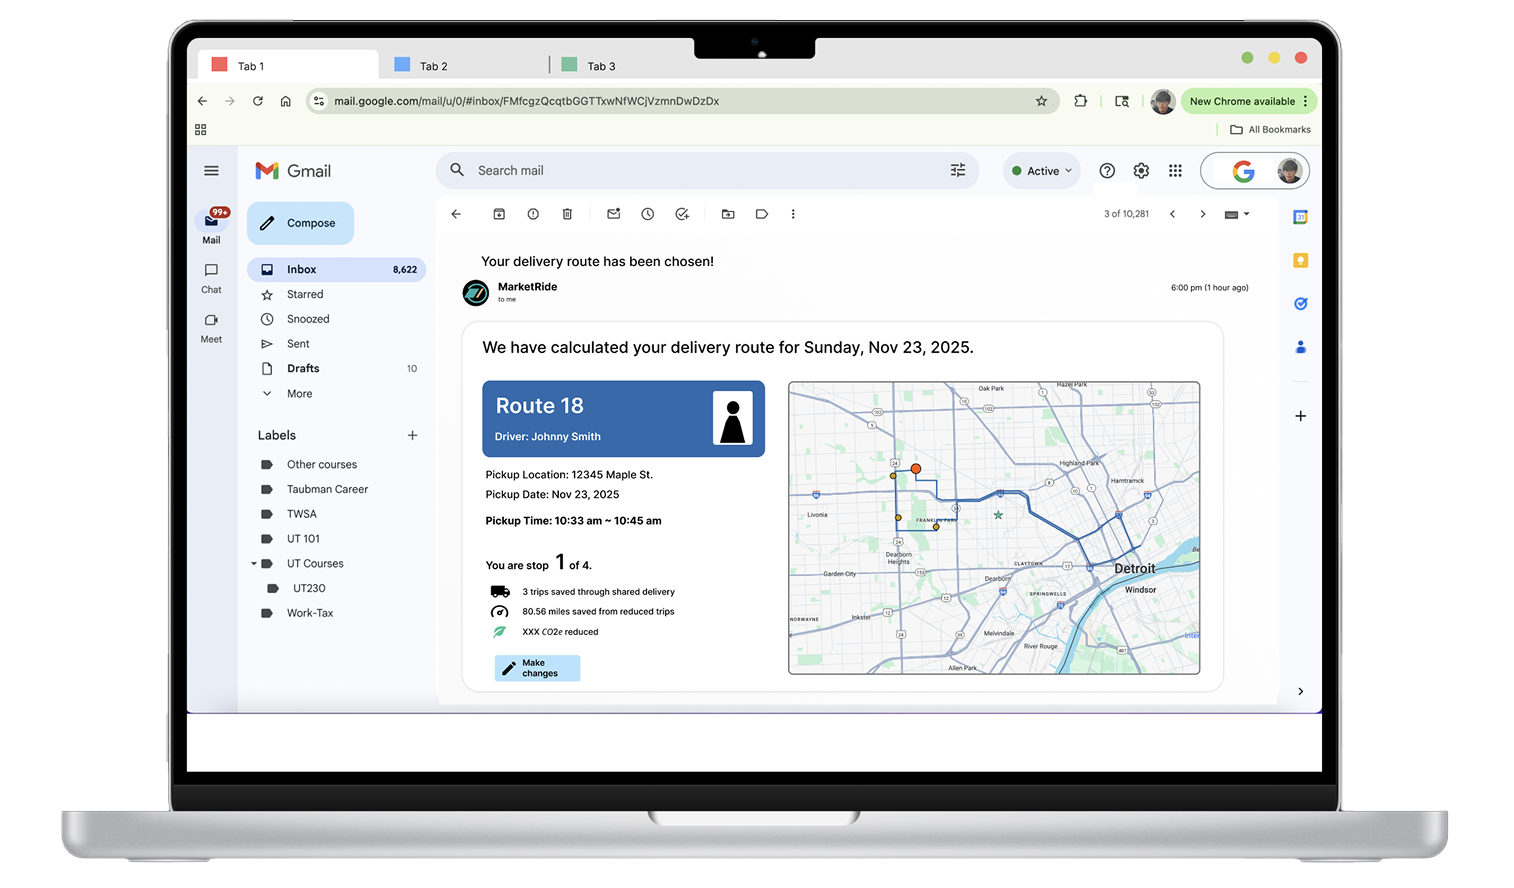
  • Coded the front and back end of both of the tools presented in this response
  • Designed the final version for project presentation
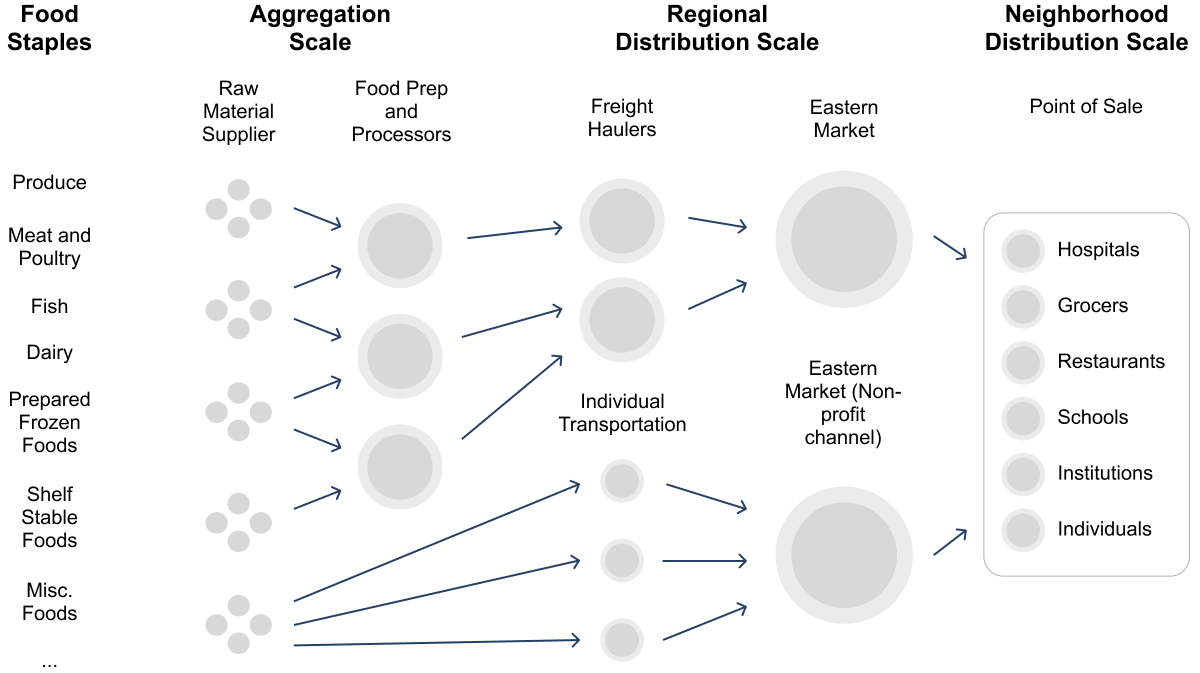
  • Interviewed several vendors at Eastern Market to spot the obstacles towards our vision

Skills and tools:

  • Qualitative research
  • Strategic design and response curation towards a vision
  • Figma, Python, osmnx, networkx, geopandas, scikit-learn, geopy, Open Route Service

Methodology:

Describe a future worth desiring and a strategy for putting that future within reach. This should include a vision for life in a specific place, flourishing with specific outcomes, enabled by new or newly augmented urban systems, imagined on a specific timeline.

Eastern Market is one of the oldest and most thriving parts of Detroit. Home to numerous active food businesses as well as a massive weekend farmers market, this district is also a short distance from downtown. It serves business owners, shoppers, tailgaters, residents, and more. It has opportunity spaces that design interventions can be proposed to make Eastern Market an even better version of itself. As a result, a vision that is ambitiously distinct from today’s status quo can be described and possibly made real by a set of solutions responses to the opportunity spaces.

Mission Statement

By 2030, Eastern Market will become the first publicly documented marketplace in Michigan to have a coordinated shared green economy by consolidating produce transportation, and spreading awareness on carbon footprint for growers selling their products at Eastern Market.

Who is responsible?

The decentralization and the plethora of stakeholders at Eastern Market makes it hard to consolidate operations and measure emissions. Here are a few influential stakeholders involved in Eastern Market's operations for example.


These stakeholders represent Growers, Governments, Non-profits, Market admins, Customers, etc.


The current operational structure of Eastern Market can be generalized into this mode:


Nevertheless, the opportunity space exists when a challenge is present, and the opportunity space for Eastern Market's future of carbon neutrality can be summarized as:

Opportunity Space at Eastern Market


As a result, given the opportunity space, we came out with a response of 2 tools aiming to reduce all 3 scopes of Eastern Market's carbon footprint.

Note: The 3 scopes of carbon footprint are defined as follows according to the Greenhouse Gas Protocol:

  • Scope 1: Direct emissions - Emissions released directly into the atmosphere from sources owned or controlled by an organization
  • Scope 2: Indirect energy emissions - Indirect emissions from the generation of purchased or acquired energy (e.g., electricity, steam, heating, and cooling) consumed by the organization
  • Scope 3: All other indirect emissions - All other indirect emissions that occur across a company's entire value chain, both upstream (in the supply chain) and downstream (from consumers). These are often the hardest to track and typically account for up to 90% of a company's total footprint

But wait a minute...

Isn't carbon footprint infinite? Take the LCA (Life Cycle Assessment) of a tomato as example:

LCA of a tomato

This is the reason why we are focusing on higher levels in the LCA. They take up the majority of the carbon footprint, and optimizing them provides a better approach to achieving the vision in the long run.


Tool 1: Transportation Transportation

This tool is aimed to reduce the Scope 3 emissions produced by individual vendor transportation from scattered urban farm locations to Eastern Market.

Justification

What justified a tool for consolidating transportation is a the 2024 Carbon Report of the non-profit Annie's Farm. Treated as a typical example here, it reflects that apart from production (which is out of hands for Eastern Market and our project), transportation is a major source of carbon emission that our tool can mitigate.


Source: Annie's Farm 2024 Carbon Report


The Current Situation - Individual & Unorganized


Each farmer drives their own truck to Eastern Market


The Newtrality Method - Coordinated & Shared


Eastern Market consolidates the transportation of their merchandise


Demo

This is a demo of the front end interface we developed for the Newtrality transportation tool. On the back end, what it does can be briefly summarized into these steps below. Also check out for the full codebase for our solution.

  1. Vendor Data Preperation: The pipeline begins with a spreadsheet of 20 sample vendor locations in the Metro Detroit region.
  2. Geocoding: Addresses are converted to geographic coordinates (lat, lon). The script queries a geocoding API for any stop that lacks pre-existing coordinates.
  3. Building the Road Network: This project routes vehicles on real roads (complete drivable road network) from OpenStreetMap using the osmnx library.
  4. Calculating Individual Routing: This gives the total distance and time the current system requires if no consolidation happens.
  5. Clustered Delivery Routing: THis is done by 2 techniques:
    1. Geographic Clustering:The 20 vendor locations are grouped into clusters of nearby stops using k-means clustering on their coordinates. Vendors in the same cluster are geographically proximate, so one truck can efficiently visit all of them in a single loop.
    2. Traveling Salesman Problem (TSP) per Cluster: For each cluster, the script solves the classic Traveling Salesman Problem - starting from Eastern Market, visit every vendor in the cluster exactly once, then return to Eastern Market in the order that minimizes the total driving distance.


Vendor View

Vendors receive an email/text like this before the delivery truck arrives.


Before & After Newtrality - A Comparison

The Newtrality transportation tool’s effectiveness is proved in the solution. Line thickness indicates route density on each road segment, thicker lines mean more routes share that same stretch of the road.


Before (left) and After (right) Newtrality

Scenarios for Vendor Transportation

We solved the merchandise, but what about vendors themselves? We analyzed the carbon footprint for these 4 scenarios with and without refrigeration to see how effective our solution is.


Tool 2: Simulation Simulation

This tool is aimed to foster the carbon awareness of urban farmers/growers and motivate them to reduce their carbon footprint in the way they grow. This tool targets and aims to reduce their Scope 1 emissions.

Justification

What justified a tool for fostering the farmers/growers' awareness of carbon footprint is the primary information from our interview and secondary information from other groups working with urban farmers/growers. Many of them have poor growing practices and there is no readily available commercialized tools that conveniently allow farmers/growers to quantify and visualize their carbon footprint and help them improve their growing practices.


Proposed Functionalities

Farmers/growers can opt in to use their camera to capture the crop they are growing and answer a few simple questions or manually input all the information and an estimation of their carbon footprint is calculated. Here is a flow chart of how this tool works:


Estimation of a scenario

Benefits and Piloting Plan

In general, our response to Eastern Market's future of carbon neutrality has the following benefits:


  • With our transportation tool, we aim to harness the power of collective routing among vendors and extend this model to other farmers’ markets, moving together to a carbon neutral near future.
  • With our simulation tool, we aim to move beyond the status quo of carbon blind spots and begin building a more sustainable future through improved everyday practices.

Next Steps

  • For our transportation tool, our goal is to test if EMP-managed truck routes reduce total CO₂e. This takes 15 eligible local vendors, 5 Eastern Market trucks, and 8 - 12 weeks. We measure change in total km and CO₂e (baseline individual vs. clustered), Eastern Market cost per km/per kg vs vendor self-delivery, and vendor and staff feedback (stress, willingness, etc.)
  • For our simulation tool, our goal is to help farmers understand and reduce their carbon footprint. This takes 15–30 farmers and one growing season. We measure whether farmers are using the tool more than once, farmers reporting at least one change in their growing practices, and estimated CO₂e reduction from changed practices.